CIMR L2 TSA Processing Chain for the Demonstration Reference Scenario (PICASSO)#
Show code cell content
import os
import sys
import numpy as np
import xarray as xr
import pyresample as pr
import importlib
from matplotlib import pyplot as plt
from matplotlib import colors

# local imports
if '/tools/' not in sys.path:
    sys.path.insert(0, os.path.abspath('../.../') + 'algorithm/tools/')
import l2_format as l2
import TSA_algorithm as algorithm
import l2_tools as tools
Show code cell source
# reload local imports
importlib.reload(l2)
importlib.reload(algorithm)
importlib.reload(tools)
algo = 'Pulliainen2010'
algo_version = '0.9.0'

l1x_scenes = ('devalgo_geometric', 'devalgo_radiometric', 'sceps_polar1')
l2_grids = ('ease2-3.125km-nh','ease2-1.0km-testcard')
# set test_card_name
test_card_name = l1x_scenes[1]      # alternative: test_card_name = l1x_scenes[0]
l2_grid = l2_grids[0]               # nominal L2 product grid
if test_card_name == 'devalgo_geometric':
    # DEVALGO simulated geometric test card
    l1x_path = os.path.abspath('../../../..../') + 'Data/L1C Files/Geometric/'
    l1x_fn = 'W_PT-DME-Lisbon-SAT-CIMR-1X@KA_C_DME_20230417T105425_LD_20280110T114800_20280110T115700_TN.nc'
elif test_card_name == 'devalgo_radiometric':
    # DEVALGO simulated radiometric test card
    l1x_path = os.path.abspath('../../../..../') + 'Data/L1C Files/Radiometric/'
    l1x_fn = 'W_PT-DME-Lisbon-SAT-CIMR-1X@KA_C_DME_20230420T103323_LD_20280110T114800_20280110T115700_TN.nc'
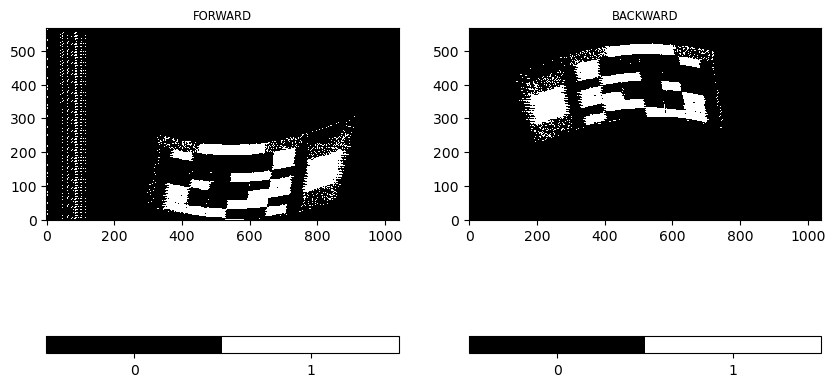
Step 1: Dry Snow Detection#
# read L1X data
data_fwd,geo_fwd,data_bck,geo_bck = tools.read_l1x(l1x_path + l1x_fn)
# detection forward and backward
TSA_fwd = algorithm.dry_snow_detection(data_fwd,tsa_algorithm=algo)
TSA_bck = algorithm.dry_snow_detection(data_bck,tsa_algorithm=algo)
C:\Users\zschende\OneDrive - Ilmatieteen laitos\Files\Projects\CIMR Devalgo\ATBD\TerrestrialSnowArea_ATBD_v2\algorithm\TSA_algorithm.py:27: FutureWarning: The return type of `Dataset.dims` will be changed to return a set of dimension names in future, in order to be more consistent with `DataArray.dims`. To access a mapping from dimension names to lengths, please use `Dataset.sizes`.
  shp = tuple(data['KA'].dims[d] for d in ['n_scans_interleave_feed','n_samples_earth'])
Show code cell source
cmap = colors.ListedColormap(['black', 'white'])
vrange=[0,.5,1]
# cmap.set_bad(color='red')

fig, ax = plt.subplots(nrows=1, ncols=2, sharex=True, sharey=False, figsize=(10,10))

img = ax[0].imshow(TSA_fwd, vmin=0, vmax=1, interpolation='none', origin='lower', cmap=cmap)
ax[0].set_title('FORWARD', fontsize='small')
# plt.text(0.01,0.99,'TSA',va='top',color='white')
cbar = plt.colorbar(img, boundaries=vrange, ticks=[0.25, 0.75], orientation='horizontal')
cbar.ax.set_xticklabels(['0', '1'])

img = ax[1].imshow(TSA_bck, vmin=0, vmax=1, interpolation='none', origin='lower', cmap=cmap)
ax[1].set_title('BACKWARD', fontsize='small')
# plt.text(0.01,0.99,'TSA',va='top',color='white')
cbar = plt.colorbar(img, boundaries=vrange, ticks=[0.25, 0.75], orientation='horizontal')
cbar.ax.set_xticklabels(['0', '1'])

# fig.savefig('tsa_swath.png', format='png', dpi=1200, bbox_inches='tight')
plt.show()
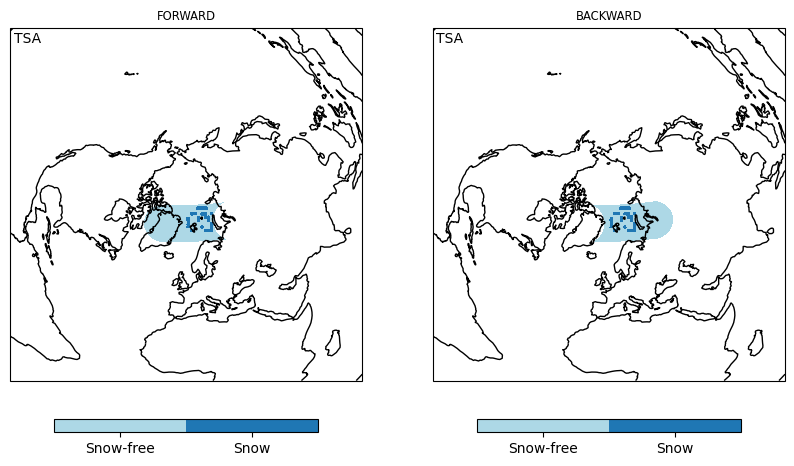
Step 2: Combined Reprojection#
Reprojection for nominal TSA product: EASE2 3.125km
Note that for the Algorithm Performance Assessment, the target grid is the same as the Test Card, namely EASE2 1km.
area_def = pr.load_area('ease2_adef.yaml',l2_grid)

cart_crs = area_def.to_cartopy_crs()
# extent = cart_crs.bounds
# trg_lon, trg_lat = area_def.get_lonlats()
Step 2.1: Individual Reprojection#
TSA_fwd_proj = tools.reproject_to_grid(TSA_fwd,geo_fwd,area_def=area_def)
TSA_bck_proj = tools.reproject_to_grid(TSA_bck,geo_bck,area_def=area_def)
Show code cell source
cmap = colors.ListedColormap(['lightblue', 'tab:blue'])
# cmap.set_bad(color='lightgrey')

vrange = [-0.5,0.5,1.5]
norm = colors.BoundaryNorm(vrange, cmap.N)

fig, ax = plt.subplots(nrows=1, ncols=2, sharex=True, sharey=True, figsize=(10,10),
                       subplot_kw=dict(projection=cart_crs))

img = ax[0].imshow(TSA_fwd_proj, transform=cart_crs, extent=cart_crs.bounds, origin='upper',
              cmap=cmap)
ax[0].coastlines(color='black')
ax[0].set_title('FORWARD', fontsize='small')
ax[0].text(0.01,0.99,'TSA',va='top',transform=ax[0].transAxes)
cbar = plt.colorbar(img, cmap=cmap, norm=norm, boundaries=vrange, ticks=[0,1], orientation='horizontal', pad=0.05, shrink=0.75)
cbar.ax.set_xticklabels(['Snow-free', 'Snow'])

img = ax[1].imshow(TSA_bck_proj, transform=cart_crs, extent=cart_crs.bounds, origin='upper',
              cmap=cmap)
ax[1].coastlines(color='black')
ax[1].set_title('BACKWARD', fontsize='small')
ax[1].text(0.01,0.99,'TSA',va='top',transform=ax[1].transAxes)
cbar = plt.colorbar(img, cmap=cmap, norm=norm, boundaries=vrange, ticks=[0,1], orientation='horizontal', pad=0.05, shrink=0.75)
cbar.ax.set_xticklabels(['Snow-free', 'Snow'])

# plt.savefig('tsa_fwdbck.png', format='png', dpi=1200, bbox_inches='tight')
plt.show()
Step 2.2: Combining Reprojections#
# intermediate combined data
TSA_comb, TSA_comb_uncert = tools.combine_proj(TSA_fwd_proj,TSA_bck_proj)
Step 3: Masking and Flagging#
# load surface information
if test_card_name == 'devalgo_geometric':
    dem_ref_scenario = os.path.abspath('../../../..../') + 'Data/Test_scenes_downscaled_projected/test_scene_2_compressed_lowres.nc'
elif test_card_name == 'devalgo_radiometric':
    dem_ref_scenario = os.path.abspath('../../../..../') + 'Data/Test_scenes_downscaled_projected/test_scene_1_compressed_lowres.nc'

data_tc = xr.open_dataset(dem_ref_scenario)
swath_def = pr.geometry.SwathDefinition(lons=data_tc['Longitude'].values, lats=data_tc['Latitude'].values)
land_mask = pr.kd_tree.resample_nearest(swath_def, np.float64(data_tc['landflag'].values), area_def,
                        radius_of_influence=20000/4, fill_value=np.nan)

data_tc.close()
# status_flag
TSA_status_flag = np.zeros(TSA_comb.shape, dtype='i8')

TSA_status_flag[TSA_status_flag == 0] = 8                    # 8: no data, out of grid
TSA_status_flag[land_mask == 0] = 0                          # 0: water
TSA_status_flag[(TSA_comb == 0) & (land_mask == 1)] = 1      # 1: land
TSA_status_flag[(TSA_comb == 1) & (land_mask == 1)] = 2      # 2: valid snow
# TSA_status_flag[] = 3                                      # 3: [placeholder]

status_flag_comment = '0: water; 1: land; 2: snow (valid); 3-7: [placeholders]; 8: no data, out of grid.'
# TSA_uncertainty
TSA_uncertainty = np.zeros(TSA_comb.shape, dtype='i8')

TSA_uncertainty[TSA_comb_uncert == 0] = 0                    # 0: very likely snow-free
TSA_uncertainty[TSA_comb_uncert == 0.5] = 1                  # 1: likely snow
TSA_uncertainty[TSA_comb_uncert == 1] = 2                    # 2: very likely snow
# TSA
TSA_l2 = TSA_comb
# TSA_l2 = np.zeros(TSA_status_flag.shape)

# TSA_l2[TSA_l2 == 0] = np.nan                                 # nan: no data, out of grid
# TSA_l2[TSA_comb == 0] = 0                                    # 0: snow free
# TSA_l2[TSA_comb == 1] = 1                                    # 1: snow covered (dry)
# TSA_l2[TSA_comb == 2] = 2                                    # 2: snow covered (wet) [placeholder]
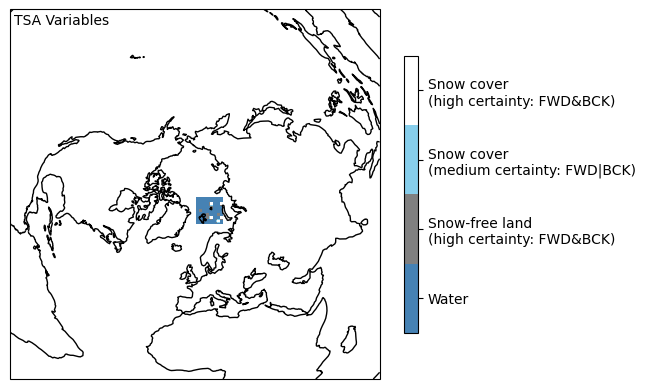
Visualization of Final Level-2 TSA Variables#
Show code cell source
TSA_map = TSA_l2.copy()

if test_card_name == 'devalgo_geometric':
    TSA_map_flag = np.zeros(TSA_l2.shape)
    TSA_map_flag[TSA_status_flag == 8] = np.nan
    # TSA_map_flag[TSA_status_flag == 0] = 0                              # water
    TSA_map_flag[(TSA_status_flag == 0) & (TSA_uncertainty == 0)] = 1   # snow-free (very likely)
    TSA_map_flag[(TSA_status_flag == 0) & (TSA_uncertainty == 1)] = 2   # snow cover (likely)
    TSA_map_flag[(TSA_status_flag == 0) & (TSA_uncertainty == 2)] = 3   # snow cover (very likely)

    ax = plt.axes(projection=cart_crs)
    cmap = colors.ListedColormap(['grey', 'skyblue', 'white'])
    vrange=[0.5,1.5,2.5,3.5]
    norm = colors.BoundaryNorm(vrange, cmap.N)

    img = plt.imshow(TSA_map_flag, transform=cart_crs, extent=cart_crs.bounds, origin='upper',
                cmap=cmap)
    ax.coastlines(color='black')
    plt.text(0.01,0.99,'TSA Variables',va='top',transform=ax.transAxes)
    cbar = plt.colorbar(img, cmap=cmap, norm=norm, boundaries=vrange, ticks=[1,2,3], fraction=0.031, pad=0.046)
    cbar.ax.set_yticklabels(['Snow-free\n(high certainty: FWD&BCK)', 'Snow\n(medium certainty: FWD|BCK)', 'Snow\n(high certainty: FWD&BCK)'])

elif test_card_name == 'devalgo_radiometric':
    TSA_map_flag = np.zeros(TSA_l2.shape)
    TSA_map_flag[TSA_status_flag == 8] = np.nan
    TSA_map_flag[TSA_status_flag == 0] = 0                              # water
    TSA_map_flag[(TSA_status_flag == 1) & (TSA_uncertainty == 0)] = 1   # snow-free land (very likely)
    TSA_map_flag[(TSA_status_flag == 2) & (TSA_uncertainty == 1)] = 2   # snow cover (likely)
    TSA_map_flag[(TSA_status_flag == 2) & (TSA_uncertainty == 2)] = 3   # snow cover (very likely)

    ax = plt.axes(projection=cart_crs)
    cmap = colors.ListedColormap(['steelblue', 'grey', 'skyblue', 'white'])
    vrange=[-0.5,0.5,1.5,2.5,3.5]
    norm = colors.BoundaryNorm(vrange, cmap.N)

    img = plt.imshow(TSA_map_flag, transform=cart_crs, extent=cart_crs.bounds, origin='upper',
                cmap=cmap)
    ax.coastlines(color='black')
    plt.text(0.01,0.99,'TSA Variables',va='top',transform=ax.transAxes)
    cbar = plt.colorbar(img, cmap=cmap, norm=norm, boundaries=vrange, ticks=[0,1,2,3], orientation='vertical', pad=0.05, shrink=0.75)
    cbar.ax.set_yticklabels(['Water', 'Snow-free land\n(high certainty: FWD&BCK)', 'Snow cover\n(medium certainty: FWD|BCK)', 'Snow cover\n(high certainty: FWD&BCK)'])

# fig.savefig('tsa_l2product.png', format='png', dpi=2400, bbox_inches='tight')

plt.show()