Baseline Algorithm Definition#
The TSA algorithm is based on dry snow detection as described by Hall et al. [2002] and Pulliainen et al. [2010]. This empirical algorithm is based on the underlying physical principle that microwave radiation of higher frequencies is attenuated by snow cover due to volume scattering, while lower frequencies remain mostly unaffected. The TSA product is only concerned with snow cover in the Northern Hemisphere, where seasonal terrestrial snow predominantly occurs.
See also
Refer to the Annex for a top-level script of the Level-2 TSA algorithm including output file generation, and for a step-by-step visualization.
Retrieval Method#
The retrieval of TSA encompasses the following main steps:
Step 1: Dry snow detection algorithm
Step 2: Combined reprojection of forward and backward TSA maps
Step 3: Masking and Flagging for final TSA maps including qualitative uncertainty estimates
Note
The specifics of the retrieval methodology may be subject to change, but will follow the general structure as outlined.
Forward Model#
The origins of the implemented algorithm stem from Chang et al. [1987], who present a linear relationship between snow depth and spectral difference, as given in (1). This relationship is derived from an empirical fit of simulated microwave brightness temperatures for varying SWE, using a microscopic scattering model [Chang et al., 1982]. The model takes into consideration the underlying (un-)frozen surface conditions as well as the physical temperature, density, and grain size of the snowpack. Snow grains are assumed to be spherical and randomly-spaced, resulting in incoherent scattering. The radiative transfer equation is solved numerically.
CIMR Level-1b Resampling Approach#
Prior to the main TSA algorithm, the current CIMR Level-2 TSA framework includes the resampling of L1b TB data to collocate channels to a target channel. The implemented resampling approach stems from the CIMR Devalgo Tools, with the target resolution of Ku-band TB data being set to match Ka-band resolution. For future research purposes, it is encouraged to also remap X-band TB data with Ka-band as target.
Algorithm Assumptions and Simplifications#
The implemented algorithm follows a static approach, assuming that snow density and snow grain properties are spatially and temporally constant. Different land cover properties are not considered.
Level-2 End-to-End Algorithm Functional Flow Diagram#
Fig. 4 shows the functional structure for the computation of the TSA product.
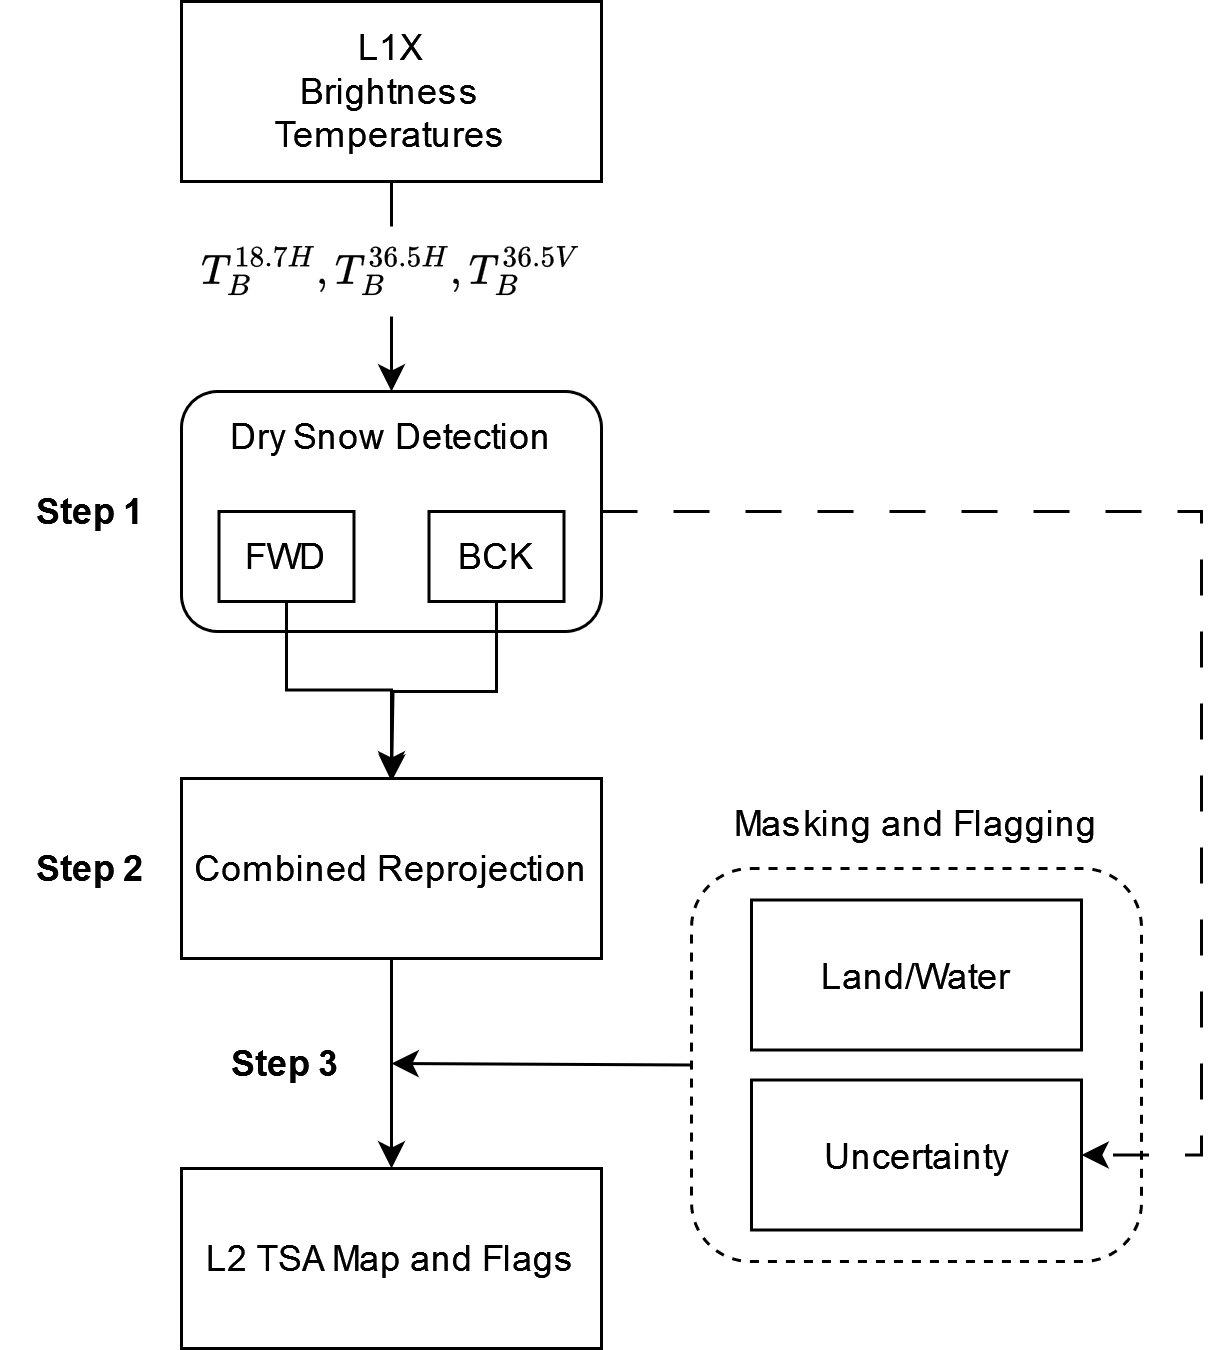
Fig. 4 Functional flow diagram of the Level-2 end to end algorithm of the TSA product.#
Functional Description of Each Algorithm Step#
The three main steps, as outlined in the flow diagram in Fig. 4, are described hereafter.
Dry Snow Detection#
Mathematical description#
The dry snow detection algorithm of the TSA product is based on the approach of Hall et al. [2002] but applies updated empirically derived thresholds as implemented for the EUMETSAT H SAF snow status product H11 [Pulliainen et al., 2010]. The brightness temperature difference between the Ku and Ka-band is used to estimate snow depth (SD) as
with regression coefficient \(R_c\) of 1.59 cm/K and brightness temperatures \(T_B\), where the superscripts indicate the frequency and polarisation. For the algorithm in (1) to detect dry snow, the following thresholds must be met:
The conditions in (1) and (2) are applied separately to TBs from forward and backward scans.
Input data#
After resampling to Ka-band as target, both the forward and backward-looking data of the following brightness temperatures are used as input:
Ku-band TBs (horizontal polarisation)
Ku-band TBs (horizontal and vertical polarisation)
Output data#
Binary TSA maps, one for each scan direction (forward and backward).
Combined Reprojection#
Description#
The preceeding dry snow detection step is applied to resampled swath brightness temperatures of both scan directions. The forward and backward TSA maps in swath format are each individually reprojected to the EASE-Grid 2.0 NH, and subsequently combined into a single map. When combining the binary TSA maps, all snow pixels are retained in order to counteract the tendency of passive microwave approaches to underestimate TSA. In other words, snow is flagged when at least one scan direction detects snow.
Input data#
Binary TSA maps, one for each scan direction (forward and backward).
Output data#
Gridded binary TSA maps, one for each scan direction (forward and backward).
Gridded combined binary TSA map
Masking and Flagging#
Description#
Although masking and flagging are not strictly necessary to retrieve TSA, this step provides relevant complementary information. Generally, flagging is preferred over masking with the reasoning that users can later individually tailor the daily TSA map to their needs.
The TSA Uncertainty Flag in its current form is based on the gridded forward (FWD) and backward (BCK) TSA maps. Grid cells which see detected snow for both scans (FWD & BCK) are flagged as ‘very likely snow covered’, whereas detected snow for one scan only (FWD | BCK) are set to ‘likely snow covered’. If no snow is detected for both scans (FWD & BCK), the flag reads ‘very likely snow free’. The Status Flag contains information for each grid cell whether its spatial location corresponds to open water, land, or snow-covered land (valid dry snow), and indicates cells with missing data or out of grid.
Input data#
Gridded binary TSA maps, one for each scan direction (forward and backward).
Gridded combined binary TSA map
Land and water mask
Output data#
TSA Uncertainty Flag
Status Flag
Auxiliary data#
For future releases, auxiliary data may be included for more comprehensive masking and flagging. Information on freshwater lakes could be considered in order to mask or flag grid cells that likely experience water spill-over effects, for instance along coastal areas or in proximity to large water bodies. Grid cells with surface water fractions larger than about 50% could accordingly be flagged. Besides, the qualitative TSA uncertainty estimates could further draw upon threshold error margins of (1) and (2), brightness temperature uncertainties and Noise Equivalent Delta Temperatures (NE\(\Delta\)T) for Ku and Ka-band brightness temperatures, as well as regional and seasonal snow likelihoods.
Ancillary data#
The masking of regions which historically do not experience snow cover according to a snow climatology may be part of future R&D activities. Such ancillary data could further compliment TSA uncertainty estimates.
Validation process#
N/a