Performance evaluation of Sea ice thickness retrieval#
For the performance evaluation of the sea ice thickness retrieval the Round Robin data Package (RRDP) in version 3.0 from [Pedersen et al., 2021], is used. The part of the dataset relevant here is the thin ice reference dataset It contains brightness temperatures and thin ice thickness retrieved from SMOS. For this evaluation of the algorithm, it can not be used directly since the 53° degree incidence angle equivalent brightness temperatures are not part of the dataset. We extracted the corresponding locations at the given days from SMOS L1C data in version 7.24.
Figure Fig. 9 shows the direct comparison of the reference dataset. The algorithm shows slightly higher ice thickness. A least square fit result in a slope of 1.5 and y-intersection of -3.0. The discrepency might come from the difference in incidence angle or the difference in the data version from the SMOS satellite. While the original dataset had a fixed upper limit at 50 cm ice thickness, the retrieval described here does not have this limit. The correlation coefficient between the datasets is r= 0.8.
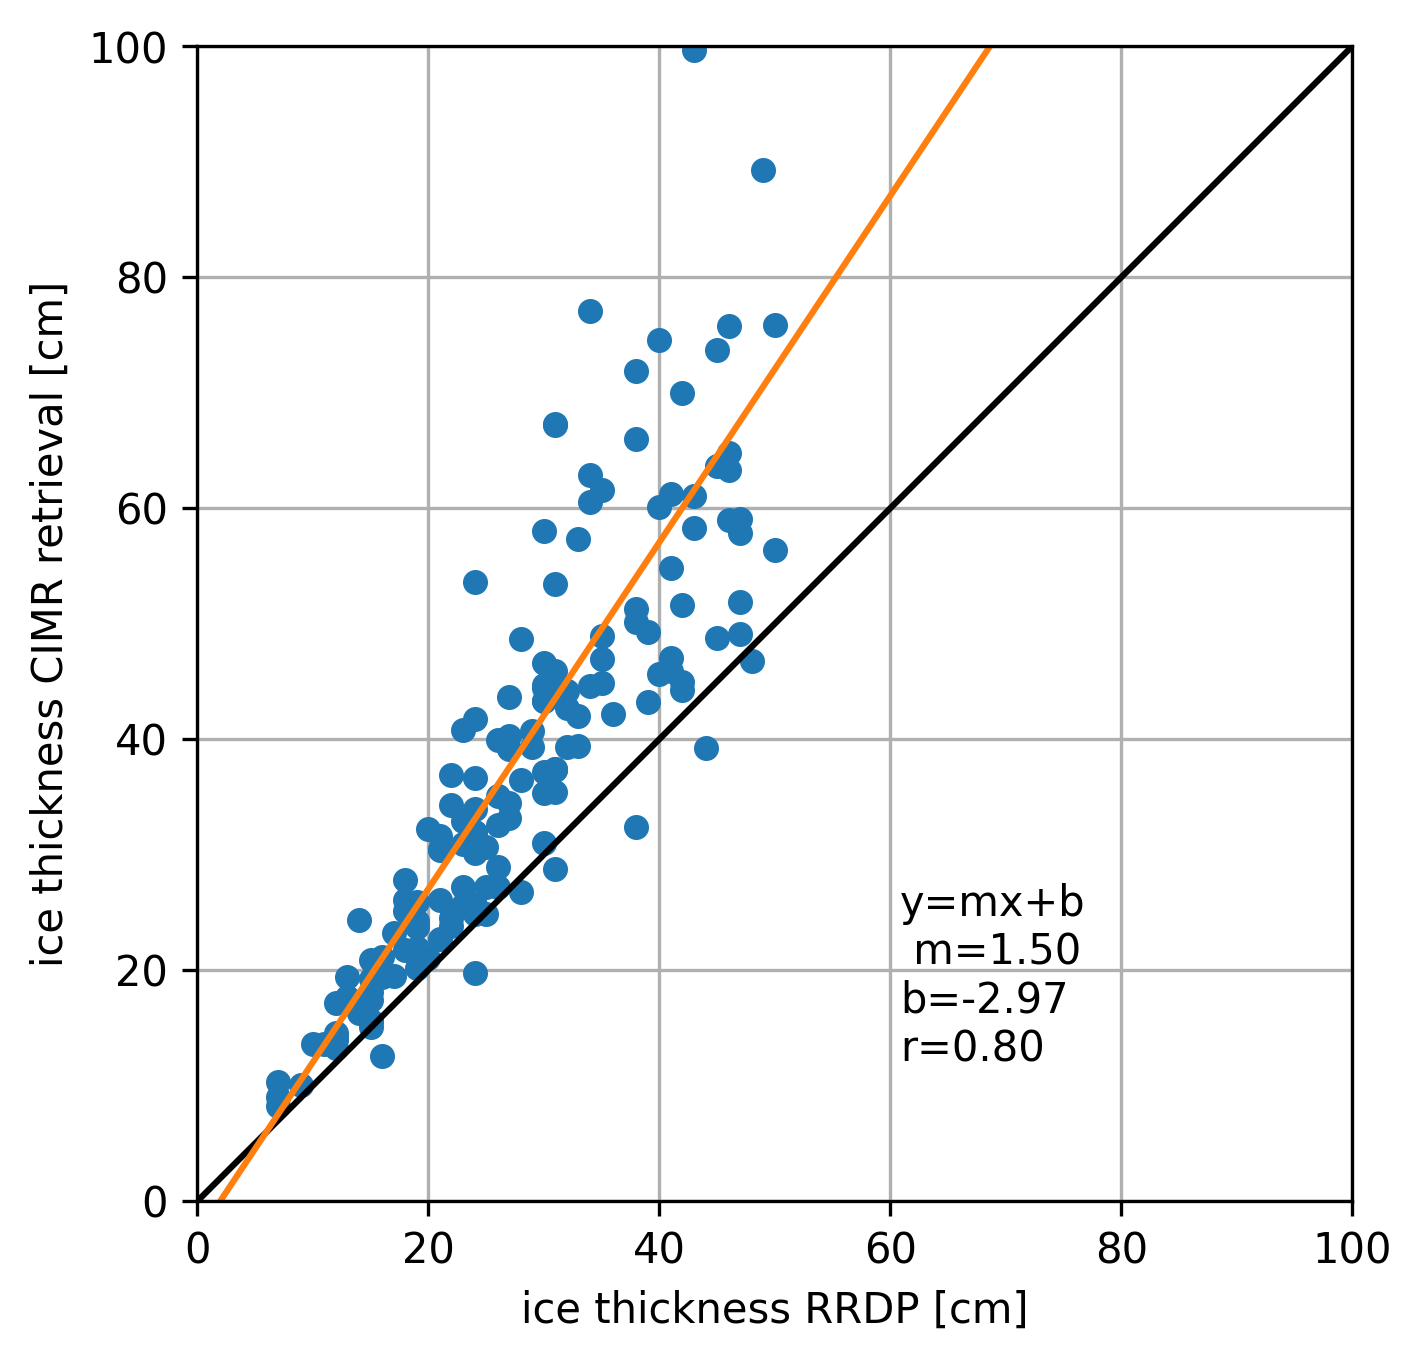
Fig. 9 Scatter plot between the RRDP reference dataset and the CIMR retrieval using SMOS data.#
In Figure Fig. 10 the locations an corresponding ice thicknesses are shown which resultet in a valid data point in the comparsion to Fig. 9. Most data points are coming from the Barents and Kara Seas as well as the Chuckchi Sea, while only few data points come from the Laptev Sea and the Baffin Bay area.
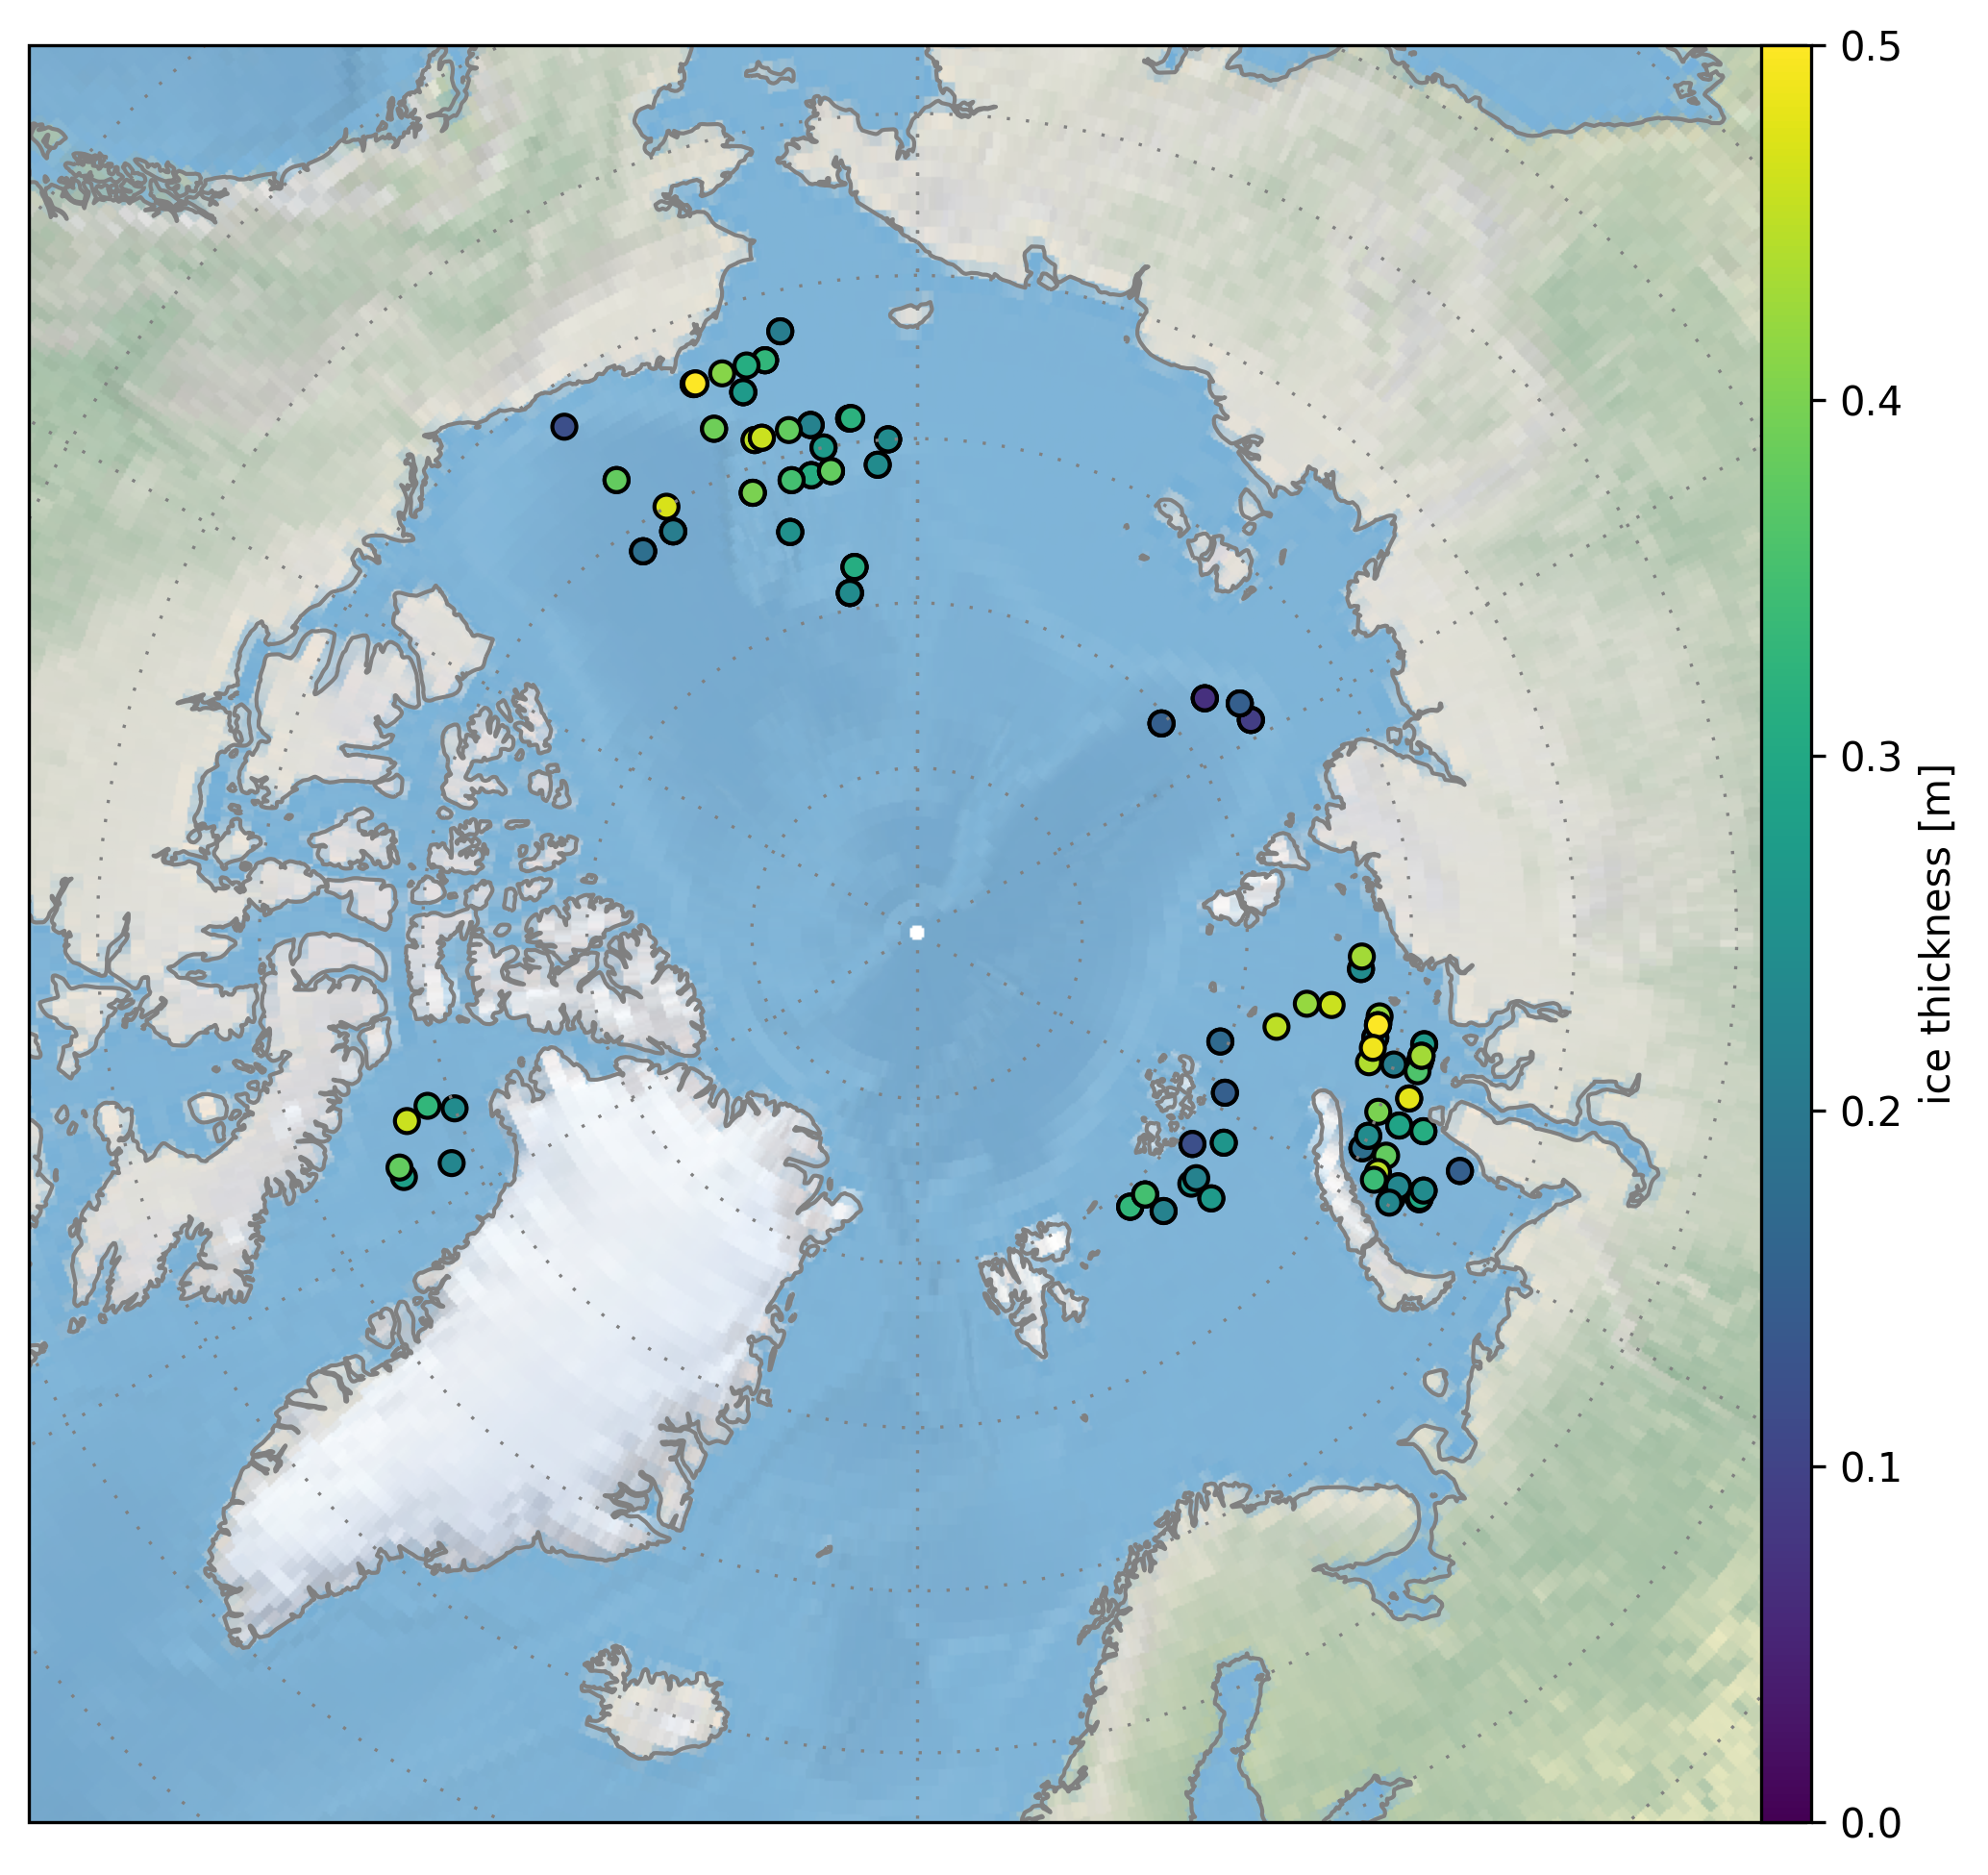
Fig. 10 Location and values of the RRDP thin ice dataset for valid comparison data.#
CIMR SIT vs SMOS SIT#
The CIMR ATBD retrieval is applied to daily gridded SMOS brightness temperature data for one day in the arctic for demonstration in Fig. 11 for the 16th of October 2021. The central Arctic is not well covered as the retrieval work on an incidence angle of 53° (SMOS averaged 50°-56°). In this incidence angle regime SMOS is nearly forward looking and thus has a very narrow swath. Typical multi year ice regions are covered with thick ice in the retrieval and are marked with a high uncertainty. Note that beyond 80cm SIT data corresponds to the extrapolation range of the agorithm and is not trustwothy. This is indicated with the high uncertainty value of the retrieval. Thinner ice is well represented at the ice edge as the 16th of October typically corresponds to a date of early freeze-up date with considerably high new ice formation. The uncertainty over open water is associated with the fact that moderate winds may increase the brightness temperatures. Which would be detected as increased ice thickness by the retrieval.
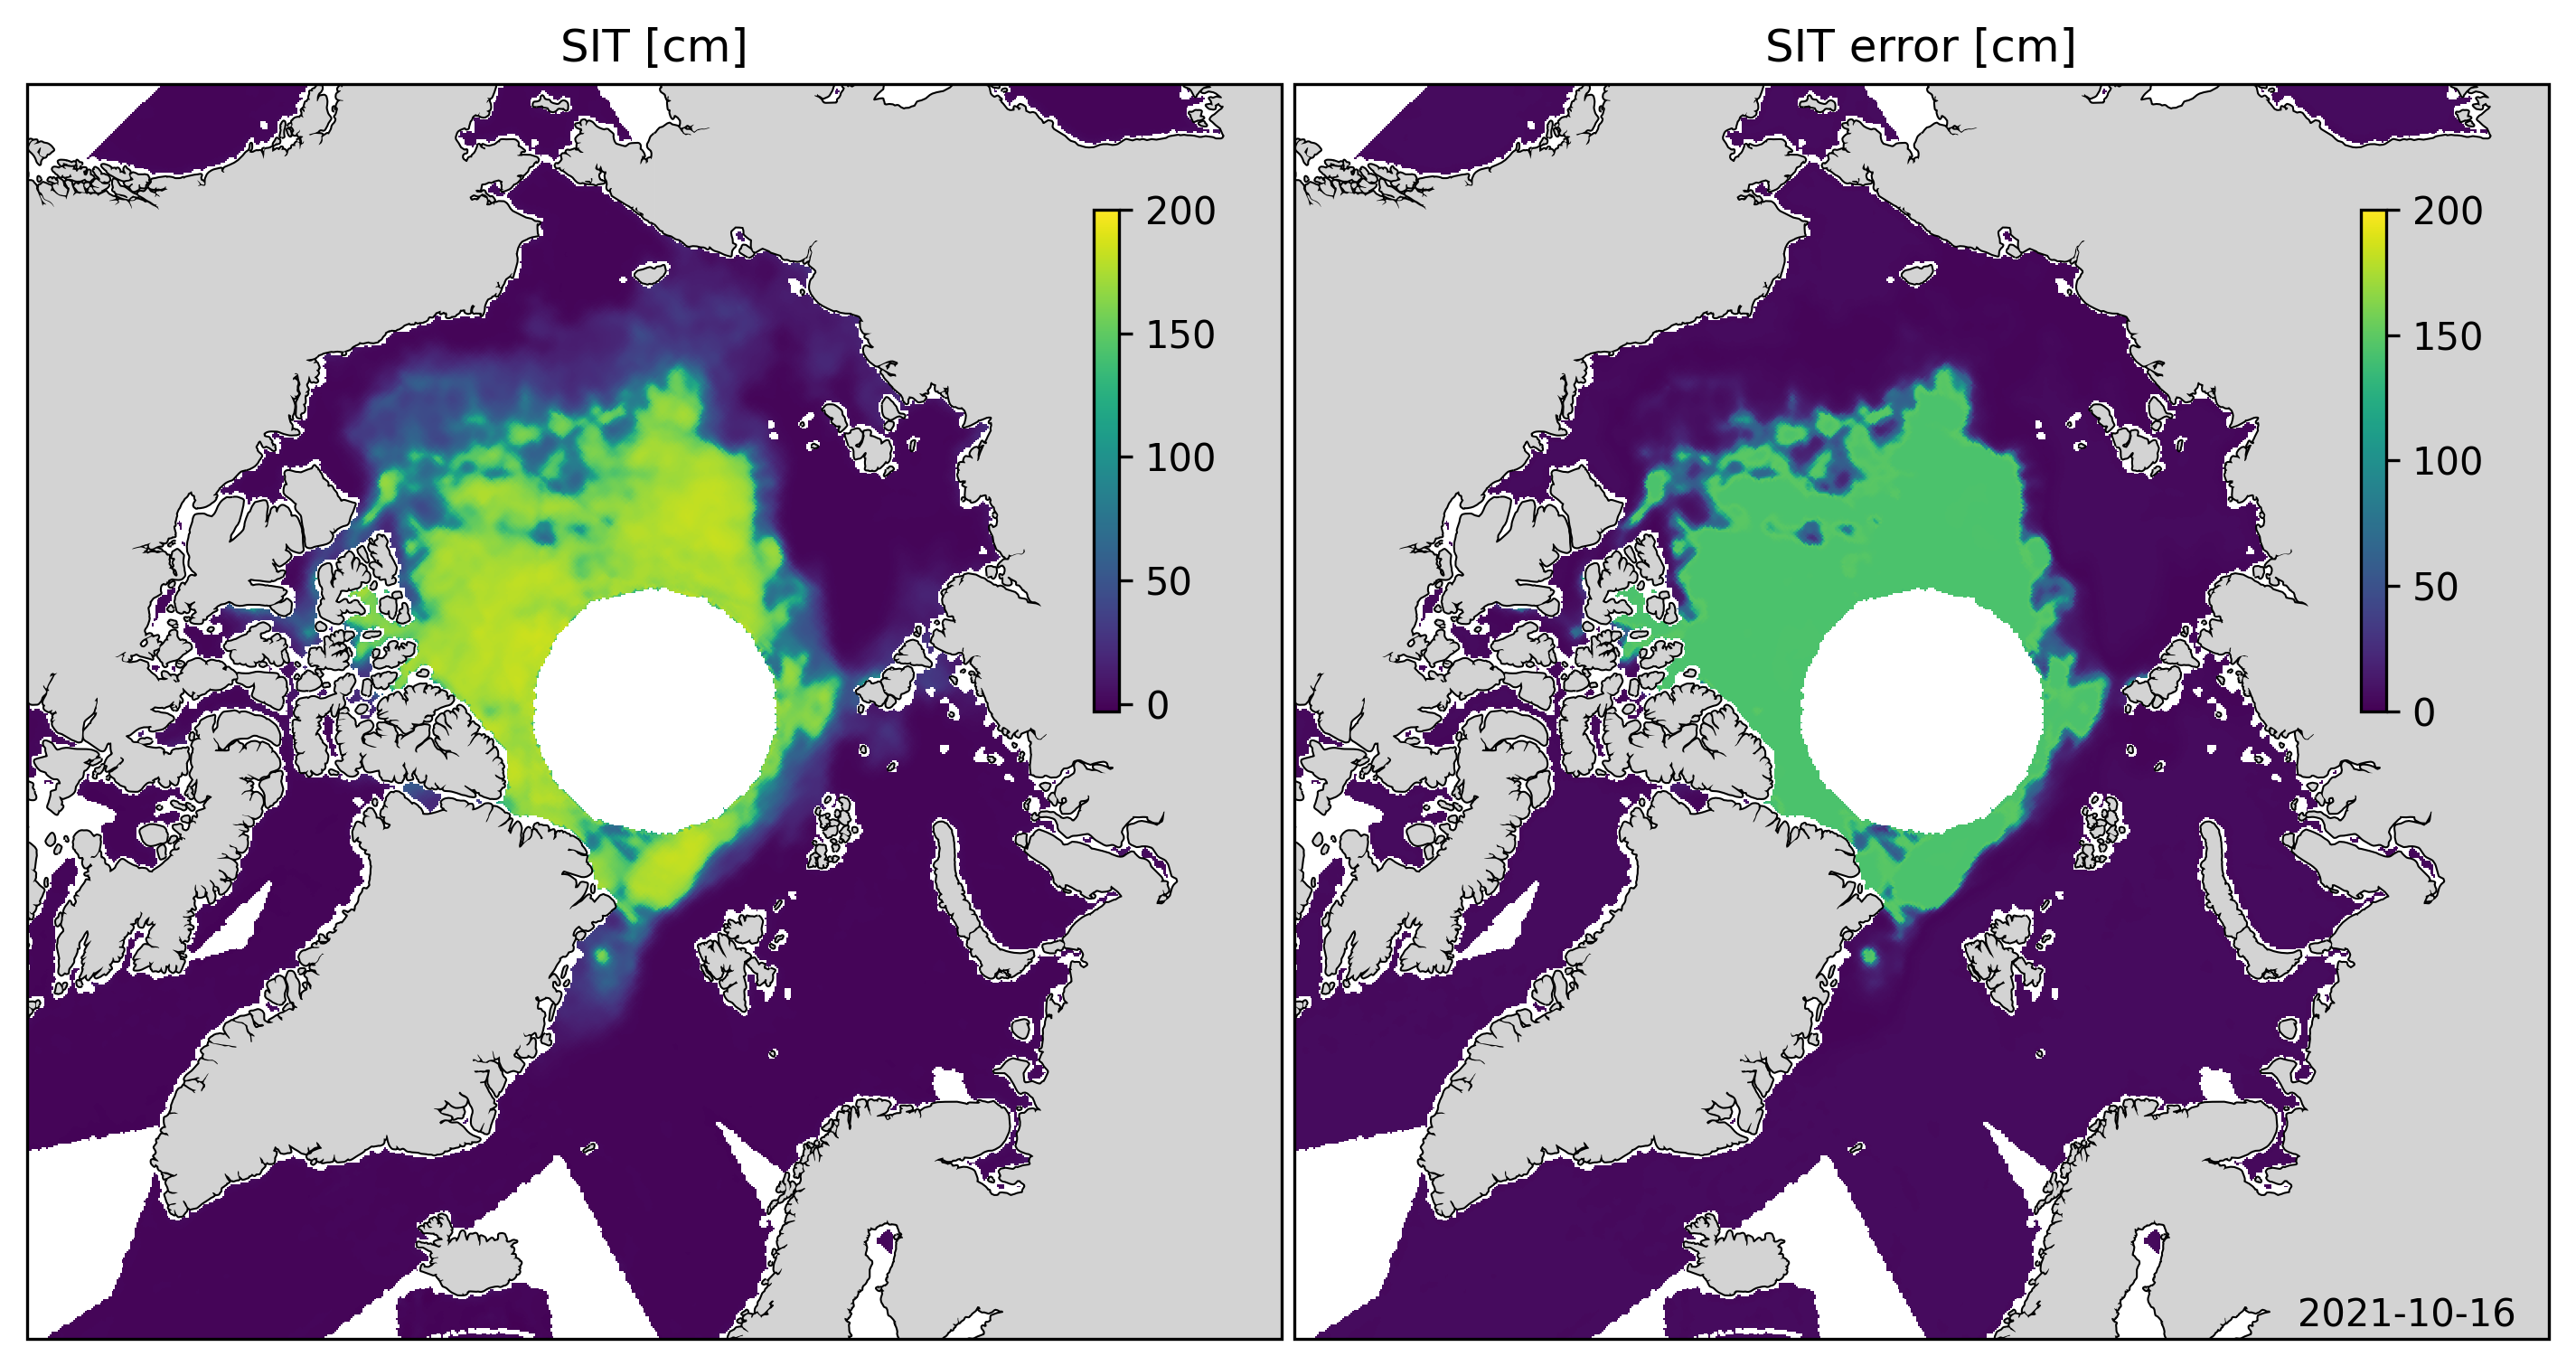
Fig. 11 CIMR SIT retrieval applied on SMOS data in the Arctic, for 16th of October 2021, left: SIT, right: SIT uncertainty.#
For direct comparison we show the ESA SMOS SIT product in Fig. 12 for the Same day using the same color scale as in Fig. 11. The central areas look a bit smoother and an overlying pattern is visible which originates from the auxiliary data as the weight of background values overpower the weight of brightness temperatures for the outcome of the retrieval [Tian-Kunze et al., 2014]`
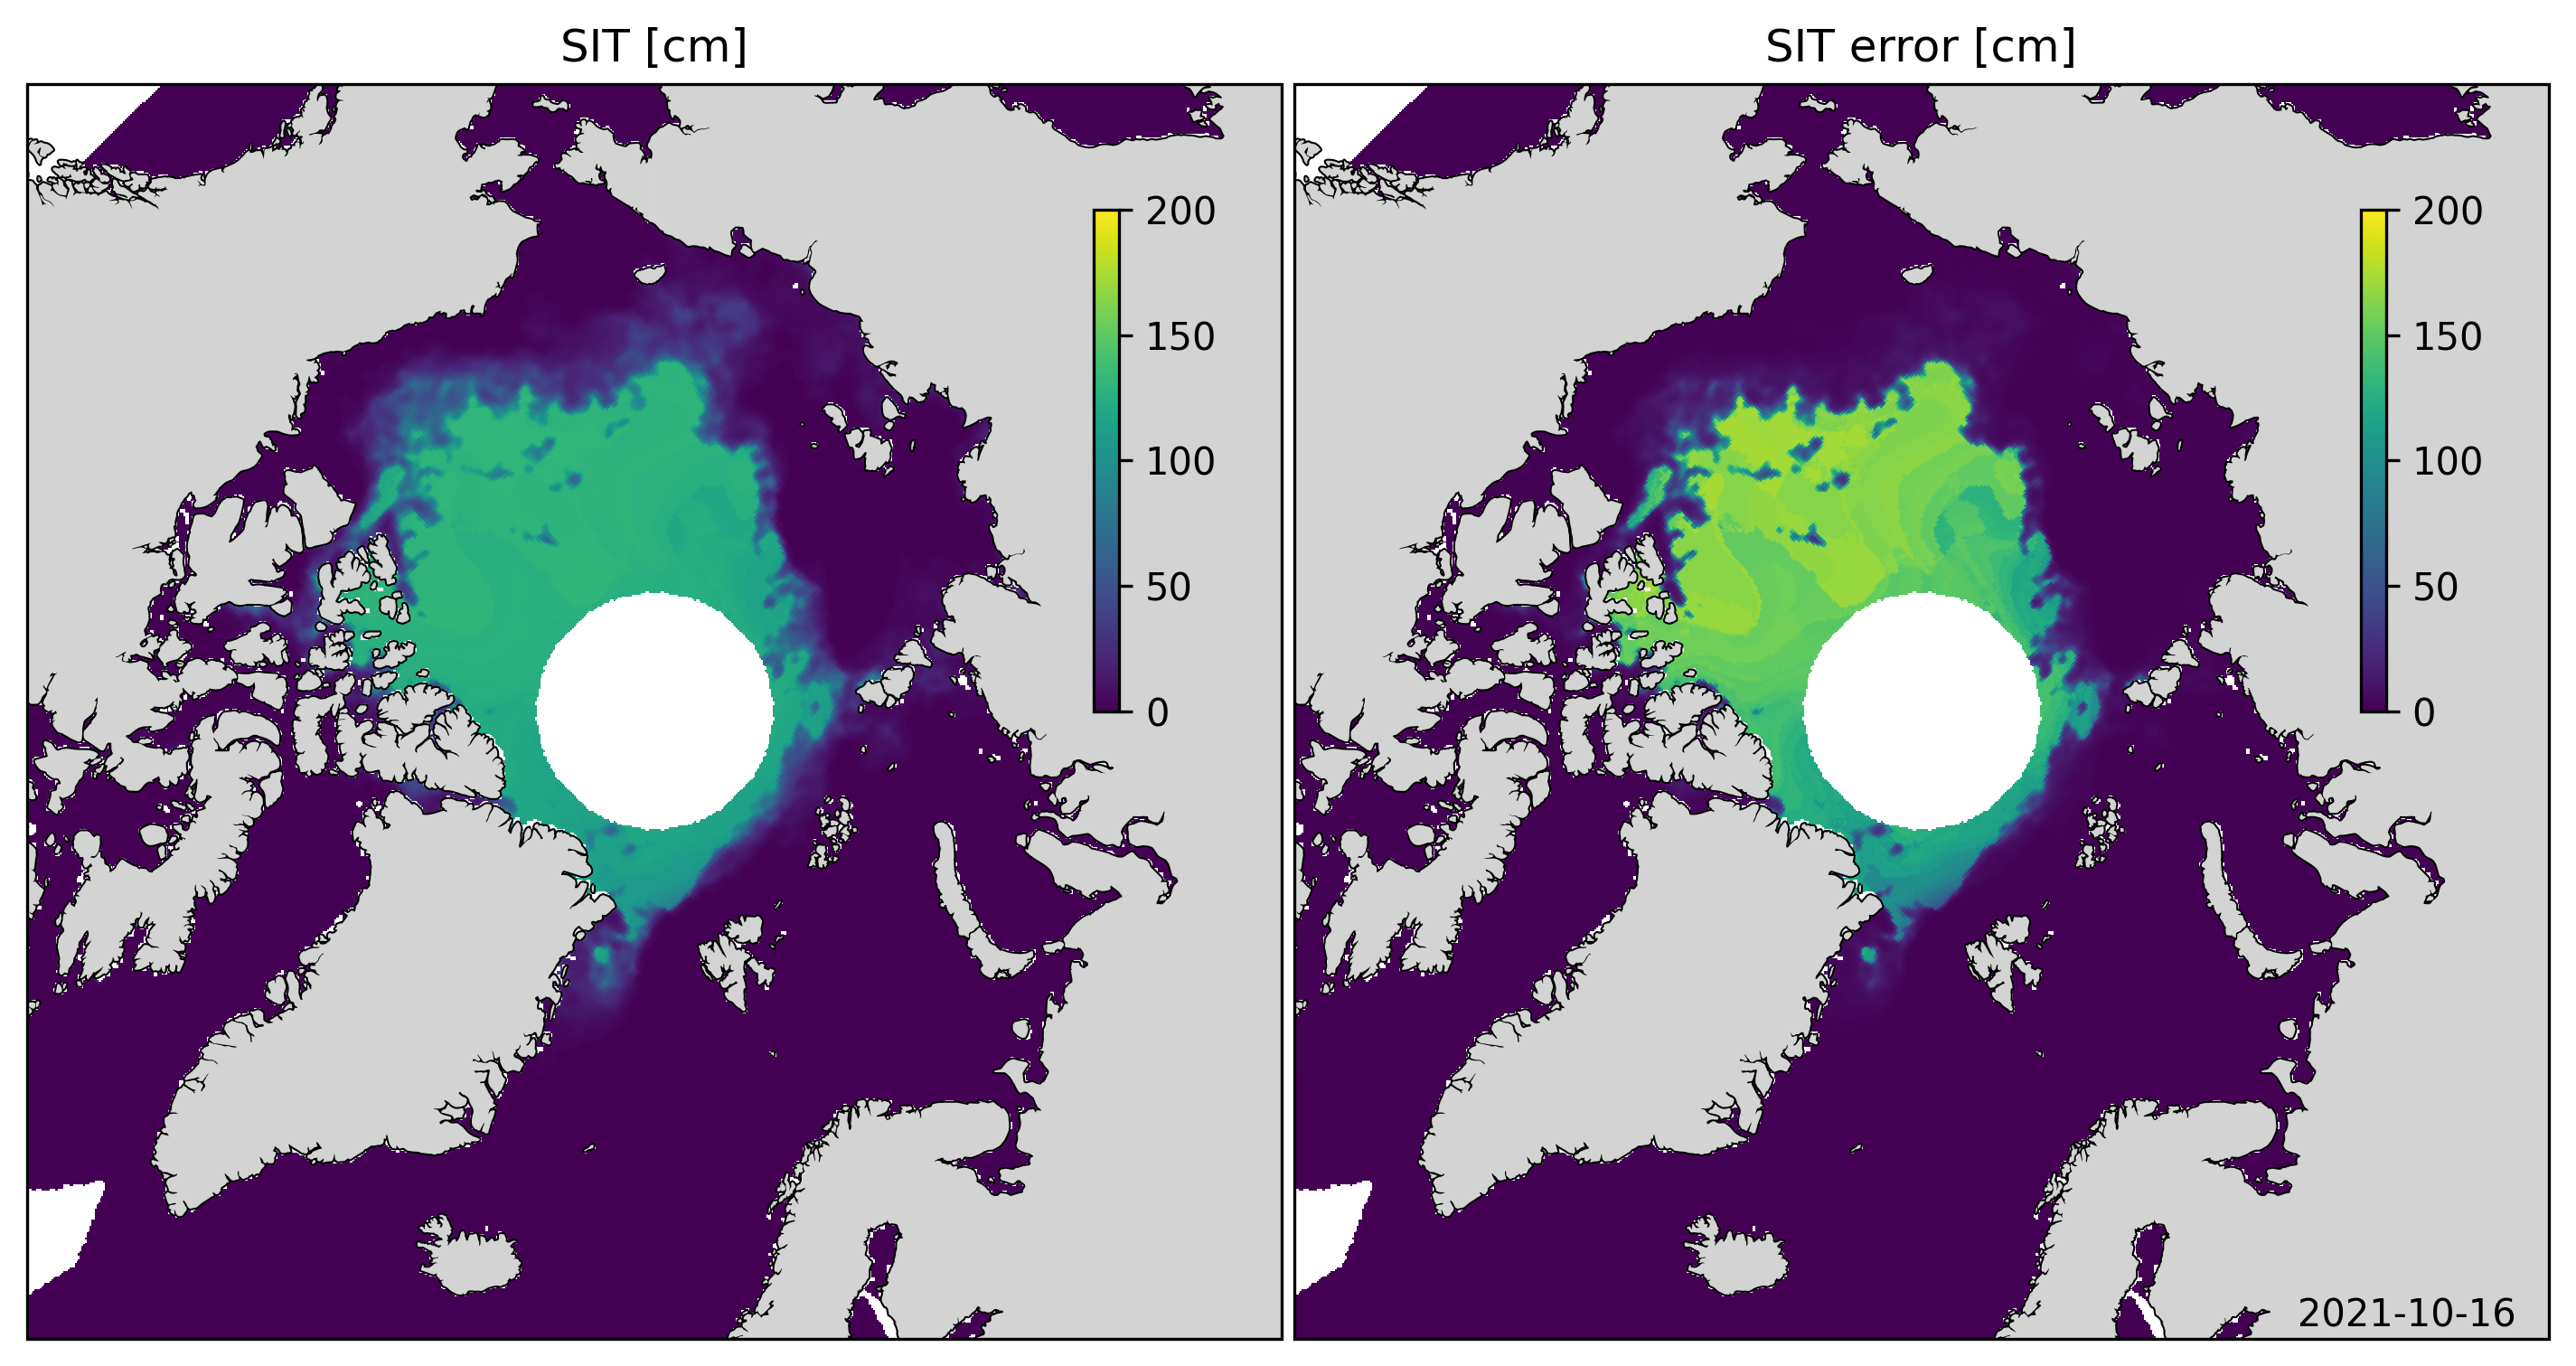
Fig. 12 ESA SMOS Sea ice thickness vs CIMR algorithm applied on SMOS data.#
A direct comparison between the ESA SIT product from SMOS and the CIMR algorithm using SMOS data is shown in Fig. 13. The agreement is very high in interediate ice thickness areas, between 50 cm and 70 cm. For thin ice, the CIMR SIT gives higher values compared to the ESA SMOS SIT retrieval. This is in line with Fig. 9. The areas where the SMOS product has 0 cm ice thickness while the CIMR retrieval gives non-zero values, probably correspond to ice pixel which are land contaminated in the brightness temperatures used by the CIMR retrieval. Note that the ESA SMOS product uses data up to an incidence angle from 0°-40° which have a smaller footprint size compared to the 50°-56° used in the CIMR retrieval. More restrictive landmasking would mitigate this issue.
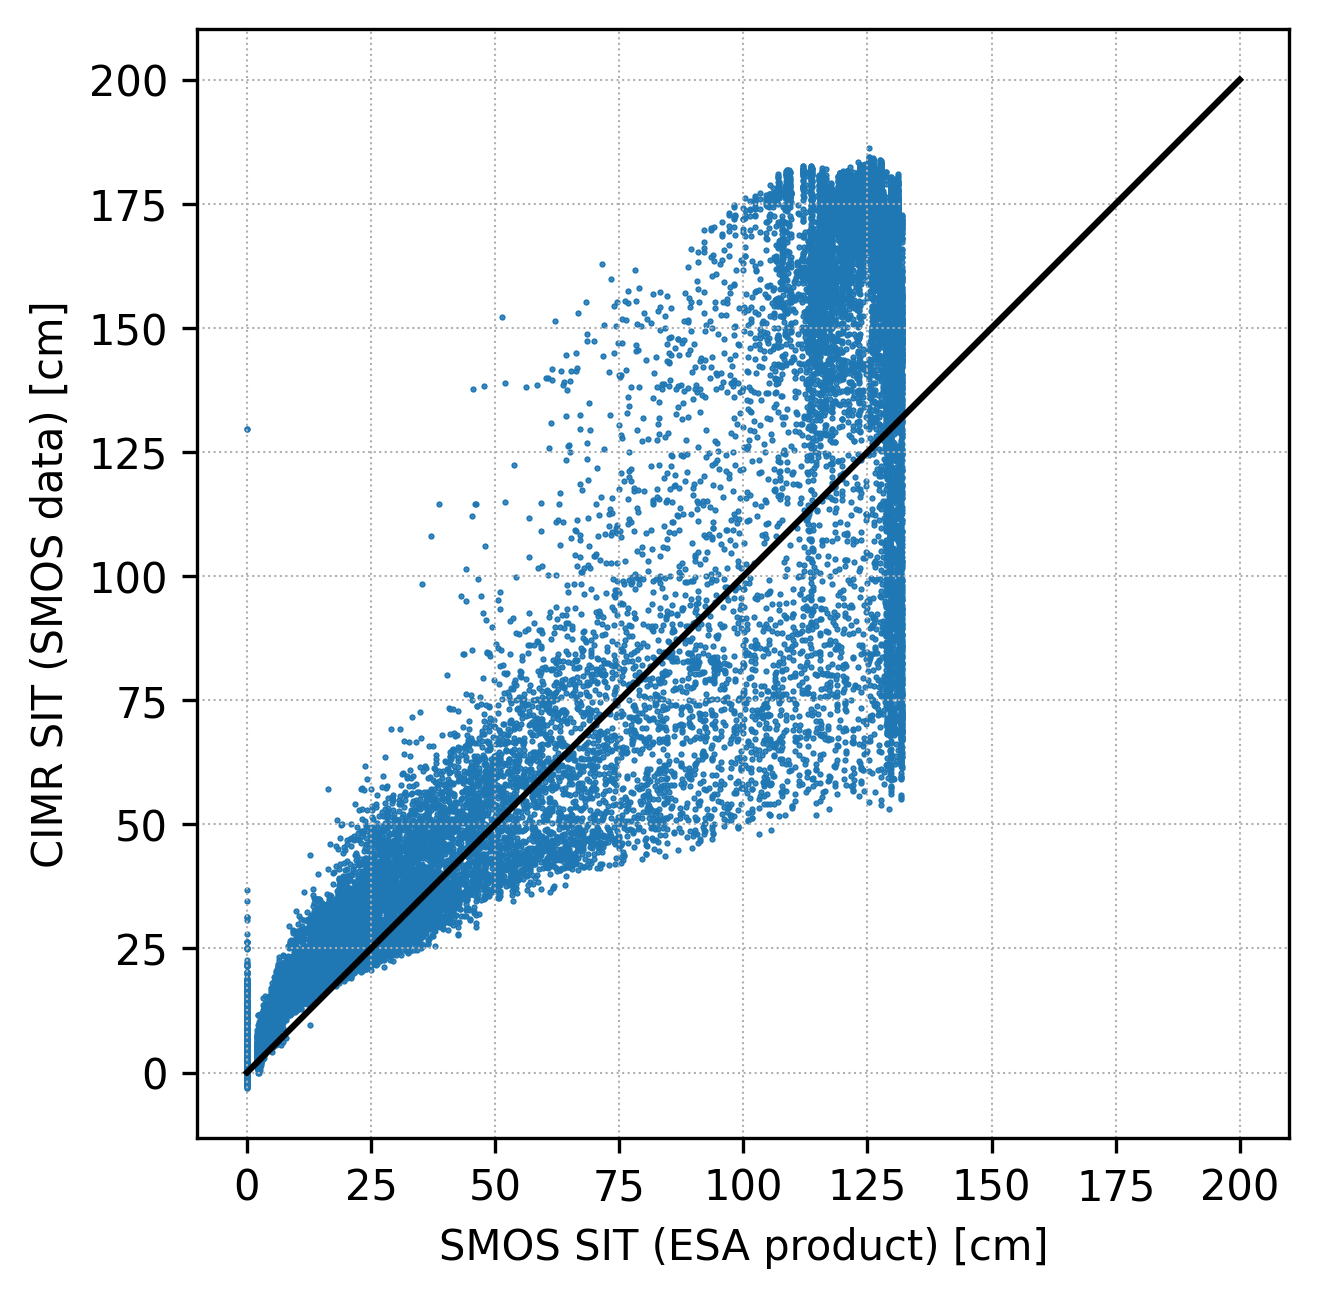
Fig. 13 ESA SMOS Sea ice thickness vs CIMR algorithm applied on SMOS data.#
In Fig. 14 the CIMR algorithm is compared to algorithm used in the SMOS ice thickness roduct from the University of Bremen. Here, also the CIMR algorithm shows about 25% higher SIT values.
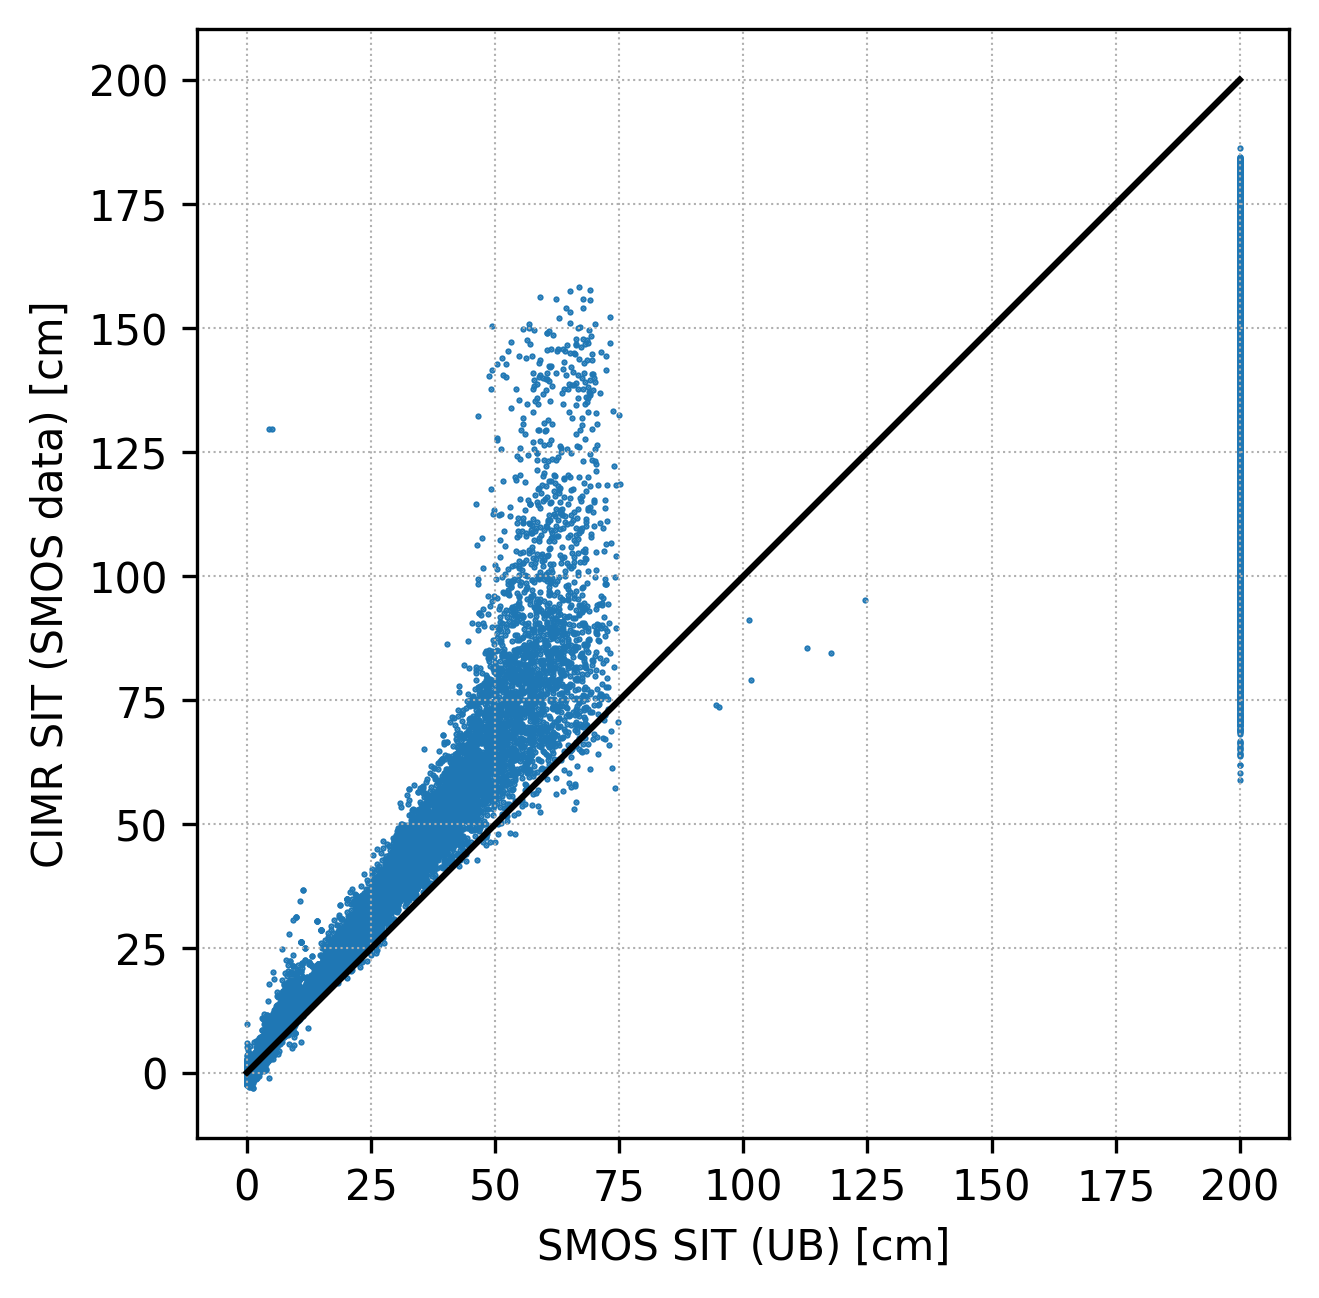
Fig. 14 Comparison of CIMR SIT retrieval (on SMOS data) with the University of Bremen SMOS SIT product.#